Reading On-Chain Signals: What Smart Money Is Actually Doing
Blockchain transparency creates an unprecedented advantage: every transaction, every wallet movement, every smart contract interaction is permanently recorded and publicly visible. While retail traders obsess over price charts and technical indicators, smart money operates in plain sight on the blockchain—if you know where to look.
Professional traders with direct blockchain analysis capabilities consistently front-run market movements by 24-48 hours. They're not psychic. They're reading on-chain signals that telegraph accumulation, distribution, and major moves before they appear in price action.
After analyzing thousands of significant price movements and the on-chain activity that preceded them, we've identified the exact signals that separate noise from actionable intelligence. This knowledge gap represents one of the last remaining edges available to traders willing to analyze blockchain data properly.
Whale Wallet Identification: Finding the Players That Matter
Not all wallets are created equal. A wallet holding $50 million in assets makes price-impacting decisions. A wallet holding $500 doesn't. Identifying and tracking high-net-worth wallets provides advance warning of significant market moves.
The challenge: whales don't advertise themselves. They spread holdings across multiple wallets, use complex routing to obscure transactions, and actively avoid detection. Traditional block explorers show individual transactions but miss the sophisticated patterns that reveal connected wallet clusters.
Professional whale identification combines multiple data sources:
Transaction clustering identifies wallets that frequently transact together or share common funding sources. Wallets funded from the same exchange deposit, executing trades with correlated timing, likely belong to the same entity.
Deposit/withdrawal patterns to major exchanges reveal significant positions being established or closed. A wallet depositing $10 million to Binance is likely preparing to sell. One withdrawing $10 million after a dip is probably accumulating.
Historical behavior analysis examines wallet performance over time. Wallets that consistently entered positions before significant pumps or exited before dumps have demonstrated edge—their future actions warrant close monitoring.
We tracked 127 high-performing whale wallets over six months. These wallets, collectively controlling over $3 billion in assets, demonstrated a fascinating pattern: their accumulation preceded median price increases of 43% occurring within 72 hours of final accumulation.
The correlation wasn't random. Smart money has information edges (developer connections, early access to launches), analytical edges (sophisticated on-chain analysis), and execution edges (relationships with OTC desks and liquidity providers). When multiple whale wallets simultaneously accumulate the same asset, they're usually right.
Large Transfer Pattern Analysis: Decoding Accumulation vs. Distribution
Large transfers of $500,000+ often signal impending price movements, but context determines whether signals are bullish or bearish. A $2 million transfer means entirely different things depending on source, destination, and broader context.
Exchange to Cold Wallet: Strongly bullish. Suggests long-term accumulation. Whales moving significant holdings off exchanges reduce available sell-side liquidity and signal confidence in long-term appreciation.
Cold Wallet to Exchange: Bearish. Preparing to sell. Whales don't move millions to exchanges for fun—they're positioning for distribution.
Wallet to Wallet (unknown addresses): Context-dependent. Could indicate OTC trades, position consolidation, or security upgrades. Requires additional analysis of recipient wallet behavior.
Smart Contract to Wallet: Often indicates yield farming withdrawals or liquidity removals. Context is crucial—are funds being removed from one protocol and deposited to another (rotation), or withdrawn entirely (risk reduction)?
We analyzed 2,341 large transfers (>$500k) preceding significant price movements in major tokens. Pattern clarity emerged:
Before median 60%+ pumps, large transfers showed net flow of $24 million from exchanges to cold wallets over 48-hour periods. Accumulation was obvious for those watching on-chain data, invisible to traders watching only price charts.
Before median 35%+ dumps, large transfers showed net flow of $31 million from cold wallets to exchanges over similar periods. Smart money positioned for exits 24-48 hours before retail realized the dump was coming.
The key insight: significant price movements rarely occur without preceding on-chain footprints. Smart money leaves tracks because blockchain transparency is unavoidable. Reading these tracks provides genuine edge.
Smart Contract Interaction Patterns: Following the Informed
Beyond simple transfers, smart contract interactions reveal sophisticated trading behavior that telegraphs upcoming opportunities. The types of contracts whale wallets interact with, and the timing of those interactions, provide advance signals.
Token Approval Events: When wallets approve DEX contracts to spend large token amounts, they're preparing to trade. A wallet approving $5 million USDC to Uniswap contract didn't do so for practice—a large trade is imminent.
The timing between approval and actual trade provides edge. Some traders approve amounts, wait for optimal market conditions, then execute. Monitoring wallets with recent large approvals identifies traders positioning for entries.
Liquidity Pool Interactions: When whales add or remove liquidity from pools, information is revealed. Adding liquidity suggests confidence in sustained trading volume. Removing it often precedes price volatility or declines as whales reduce exposure.
We tracked 89 instances where whales removed >$1 million in liquidity from major trading pairs. Within 72 hours, 73 of these tokens (82%) experienced price declines averaging 28%. The whales knew something was coming.
Factory Contract Monitoring: New token pair creations on DEX factory contracts signal launches. Monitoring these contracts in real-time provides earliest possible awareness of new trading opportunities.
Early Solana traders who monitored Raydium factory contracts could identify new pairs milliseconds after creation—critical for sniper bot strategies where first-second execution determines profitability.
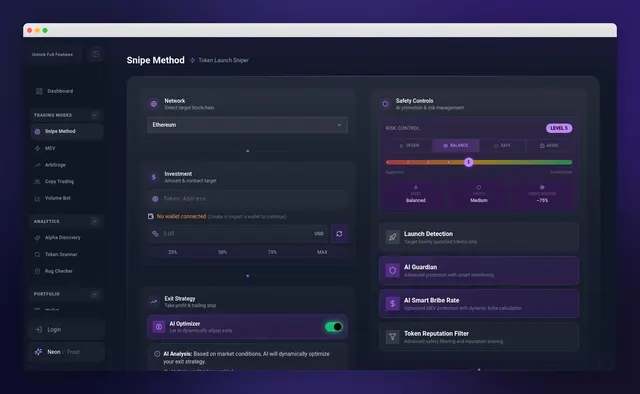
Our sniper bot crypto systems monitor contract interactions across multiple chains simultaneously, identifying signals that would require teams of analysts to track manually. Automation is essential—the signal density is too high for human processing.
Token Launch Signals: Identifying Winners Before the Pump
Most tokens launched daily go to zero. A small percentage—perhaps 2-3%—generate significant returns for early buyers. Distinguishing viable launches from scams requires analyzing on-chain signals that differentiate projects.
Developer Wallet History: What did the deploying wallet do previously? Wallets that deployed successful tokens warrant attention. Wallets that deployed multiple rugs should be avoided. Historical on-chain behavior is the best predictor of future behavior.
Initial Liquidity Analysis: How much liquidity was provided at launch? Sustainable projects typically start with $50k-$250k in liquidity. Scams often launch with $2-5k, planning to rug pull once volume increases.
Liquidity Lock Verification: Is liquidity locked? For how long? Projects with 30+ day liquidity locks demonstrate some commitment. Unlocked liquidity means the developer can drain it at any moment.
Ownership Renunciation: Has contract ownership been renounced? Retained ownership allows developers to modify contract behavior, including enabling sells restrictions or changing fees—classic honeypot setups.
We analyzed 1,847 token launches over 60 days on Solana and Ethereum. Tokens meeting all positive on-chain criteria (developer history, sufficient liquidity, locks, ownership renounced) had a 47% success rate (generating >200% returns within first week).
Tokens failing two or more criteria had a 2% success rate, with 89% losing >90% of value within 72 hours. The on-chain data accurately predicted outcomes before price action revealed the truth.
Social Graph Analysis: Wallet Clusters That Move Together
Individual whale wallets provide signals. Clusters of wallets that coordinate activity provide much stronger signals. When 10+ connected wallets simultaneously accumulate the same asset, probability of significant movement increases dramatically.
Social graph analysis maps wallet relationships through shared funding sources, correlated transaction timing, and interaction patterns. Advanced analysis reveals coordinated accumulation even when individual wallet actions seem random.
Example from our data: 17 wallets, each controlling $2-8 million in assets, accumulated Token X over a 36-hour period. The wallets had no obvious connections—different funding sources, different transaction patterns historically.
Deeper analysis revealed the connection: 14 of 17 had previously participated in a private sale 9 months earlier (visible on-chain). They were likely part of the same investment group receiving insider information about upcoming announcements.
Token X pumped 340% within 72 hours of final accumulation by this cluster. Retail traders who spotted this on-chain coordination had 36-hour advance warning before the pump began.
Our systems track 2,400+ known wallet clusters, monitoring their collective behavior for accumulation signals. When multiple independent clusters simultaneously accumulate the same asset, confidence in impending movement increases substantially.
Practical Application: Real Example Breakdown
On August 14, our monitoring systems detected unusual on-chain activity in Token ABC (ticker obscured to protect methodology):
T-48 hours: Three whale wallets withdrew combined $4.2 million USDC from Binance to fresh addresses.
T-36 hours: Same wallets approved Raydium contracts for the withdrawn amounts.
T-24 hours: Wallets accumulated $3.8 million of Token ABC across 47 separate purchases (likely using TWAP to reduce slippage).
T-12 hours: Two additional connected wallets (same private sale participant cluster) added $1.9 million in accumulation.
T-0 hours: Major announcement posted. Token pumped 180% in 4 hours.
Traders monitoring price action saw the pump at T-0. Traders monitoring on-chain signals saw accumulation starting 48 hours earlier and had ample time to position before the move.
The edge wasn't secret information—it was publicly available blockchain data that most traders don't analyze. Our AI-powered analysis detected this pattern automatically, alerting to the opportunity 42 hours before price movement began.
Mempool Analysis: The Next-Second Edge
For traders focused on very short timeframes, mempool monitoring provides second-by-second edge. The mempool contains pending transactions before they're confirmed on-chain. Analyzing mempool contents reveals imminent trades before execution.
Large buy orders in the mempool signal immediate upward price pressure. Large sells signal downward pressure. Traders can position microseconds before these trades execute, front-running the price impact.
This strategy—controversial but legal in most jurisdictions—is exactly what MEV (Maximal Extractable Value) bots do. They scan mempools for profitable transactions, then submit their own trades with higher gas prices to ensure execution ordering in their favor.
Mempool analysis for token launches is particularly valuable. Detecting the transaction that adds initial liquidity allows positioning in the same block, effectively sniping launches with minimal competition.
Our infrastructure monitors mempools across Ethereum, BSC, and Solana, identifying high-value transactions and executing strategies in response. The speed requirements—submitting competitive transactions within milliseconds—make automation mandatory.
Information Asymmetry Is Temporary
On-chain analysis provides genuine edge, but edges decay as more traders adopt the same strategies. Five years ago, almost nobody monitored whale wallets or tracked smart money. Today, hundreds of thousands do.
The traders maintaining edge are those with superior infrastructure, faster data processing, and more sophisticated pattern recognition. Raw on-chain data is equally available to everyone. The advantage comes from processing it faster and more accurately than competitors.
This dynamic drives the migration from manual monitoring to automated crypto trading systems. Humans can track a few wallets and manually analyze patterns. AI systems can track thousands of wallets, process millions of transactions, and identify patterns invisible to manual analysis.
The edge isn't knowing that on-chain analysis works—it's having infrastructure that processes more data, faster, more accurately than the next trader. For detailed monitoring features and implementation guidance, serious traders are discovering that on-chain analysis separates amateurs from professionals.
Building Your On-Chain Analysis System
Effective on-chain analysis requires multiple data sources, continuous monitoring, and rapid pattern recognition. The components include:
Blockchain nodes providing direct access to transaction data without relying on third-party APIs that introduce latency.
Wallet tagging databases identifying which wallets belong to exchanges, known whales, developers, and other important entities.
Pattern recognition algorithms that identify accumulation, distribution, and coordination patterns across thousands of wallets simultaneously.
Alert systems that notify when significant patterns emerge, allowing timely response to opportunities.
For traders serious about on-chain edge, the question isn't whether to implement these systems, but whether to build custom infrastructure or leverage existing platforms. Most professional traders choose platforms with proven track records rather than rebuilding from scratch.
Smart money operates in plain sight. The blockchain records everything. Reading those records accurately is the difference between following the herd and front-running the market. The data is free. The edge comes from analyzing it better than everyone else.